Dashboard
Fairway has one local web dashboard. It is the primary surface for observing active lanes, drilling into a lane, inspecting diagnostics, and opening task detail.
Routes
| Route | Purpose |
|---|---|
/ | Single-project product Overview using current project facts and a cited Quality Record. Multi-project mode retains the aggregated Wall. |
/wall | Single-project operational Wall with high-level role lanes for live coordination. |
/board | Operator board. Filterable/sortable task table, workstreams, gates, and activity. |
/board?tab=diagnostics | Diagnostics tab for sessions, worktrees, watchers, and checkpoints. |
/quality | Single-project lifecycle evidence matrix with cited task-level Quality Record drill-down. |
/reports | Daily and date-range work reports for outcomes, CI/deploy activity, reviews, and follow-ups. |
/controls | Single-project, read-only control-effectiveness cohorts and source-fact drill-down. Hidden in multi-project mode because projects can use different control configurations. |
/tasks/<task-id> | Task detail page with the cited Quality Record, metadata, history, evidence, sessions, reviews, and status controls. |
There is no dashboard version switch. [dashboard] surface is not part of the
active config contract; historical configs that still contain it load only
because unknown TOML keys are ignored.
Managed dashboard lifecycle commands write a versioned JSON pid record with
the process id, listen address, binary path, Fairway version, mode flags, and
start time. dashboard status reports version and binary from that record only
after matching it to the live process command. Legacy integer-only pid files
cannot prove binary/version identity and therefore report unknown; start,
stop, and restart fail closed until the operator verifies and replaces the
legacy process. The querying CLI version must never be presented as the running
dashboard version.
Why Web
- It can stay open on a second monitor while several agents work in parallel.
- Multiple people can watch the same local coordination state.
- Server-rendered HTML keeps the implementation small and inspectable.
- Browser affordances make filtering, sorting, export, and task drill-down easier than a terminal grid.
fairway tui covers headless basics for SSH sessions.
Shared Read-Only Mode
Set [dashboard] read_only = true or start with fairway dashboard --read-only when the dashboard is being shared outside the local operator
session. Read-only mode blocks dashboard mutation endpoints and hides mutation
controls; task changes still happen through the CLI from a trusted local
worktree.
For identity-aware proxy exposure, keep the Fairway origin bound to localhost and put Cloudflare Access, Tailscale, an internal reverse proxy, or another trusted access layer in front of it. See dashboard-sharing.md for the Cloudflare Tunnel + Cloudflare Access One-Time PIN reference pattern and trust-boundary warnings. For hostname migration principles, see Dashboard sharing. The dated consumer-specific plan remains in the archive.
Flow
The single-project dashboard is organized as a user flow, not independent pages:
- Start at Overview (
/) to understand the product promise, inspect current project coverage, and follow one cited work item. - Open the Wall (
/wall) to see which lanes are active, idle, or overloaded. - Use
Open laneto drill into/board?role=<role>. - Sort, search, or filter the board table.
- Open a task from the table.
- Use
Backon task detail to return to the filtered board view.
The Controls view is a separate read-only quality-evidence surface. It uses
the same controlanalytics.Report model as fairway control report; the
dashboard does not recompute applicability, cohort membership, outcome rates,
friction, or classification. Operators can filter the projection by analysis
window, outcome horizon, profile, risk band, diff-size band, control family,
and control ID. Coverage appears before outcome comparisons, and every cohort
expands to the task IDs, control states, structured outcomes, and promotion
commits behind the aggregate. Structured outcomes, Git touch commits, cohort
maturity, bypass provenance, changed-file scope, configuration identity, and
exclusions are inspectable inline. Task links provide the broader evidence,
review, and audit drill-down. The surface is advisory and cannot mutate policy,
waive a control, or authorize delivery. Multi-project dashboards omit this
route because combining projects with different control configurations would
erase cohort authority.
The single-project /quality workspace projects those same nine lifecycle
stages across a bounded, filterable page of tasks. It preserves present,
missing, unavailable, conflicting, and externally_owned as distinct
states and links every cell to the cited task-level record. It does not combine
those states into a score. See Quality workspace.
Each task detail begins with the same qualityrecord.Record projection exposed
by fairway quality-record. Its nine lifecycle rows cite durable Fairway
records or name expected/external sources. Neither projection generates a
confidence narrative or grants review, merge, deploy, release, credential, or
live-operation authority.
- Open Quality when the question is "which lifecycle facts are present, missing, unavailable, conflicting, or externally owned?"
- Open Controls when the question is "which controls discriminate, at what measured cost, and with what uncertainty?"
- Open Reports when the question is "what changed today, what finished, what failed, and what needs follow-up?"
- Switch to diagnostics from the board when session/worktree/watcher state is the question.
See Dashboard Overview for the newcomer journey, current-project proof model, and authority boundary.
Wall
The wall view is intentionally compact. It answers: "What is each lane doing right now?"
In multi-project mode, the wall groups lanes under collapsible project headers, prefixes activity summaries with the project name, and shows a per-project readiness rollup in the right rail.
Each role lane shows:
- current/idle state,
- representative backlog, claimed, working, review, and done task pills,
- overflow links that drill into the matching board filter,
- a lane-name toggle that opens one inline detail panel at a time. The panel
shows queue, current working card, pending reviews, latest events, and an
Open full details for <role>link to the board filtered by role.
Typed SSE events update the wall in place. Handoff events draw a short-lived arc between source and target lanes and increment the handoff metric. Activity events prepend verb-first ticker entries and maintain relative timestamps. Session heartbeat events pulse the attached working task pill while fresh, soften the pulse after one minute, and mute the pill after five minutes without inventing synthetic heartbeat state.
Review wait SSE events are advisory updates derived from the Fairway DB review
wait projection. The dashboard may emit review_wait.stale,
review_wait.notification_failed, and review_wait.resolved so open clients
can refresh operator-visible state. These events are safe to lose because
Fairway DB remains authoritative and the next poll or page load reconstructs
the current wait rows.
The lane header distinguishes live provider attachments from task status. An
active session label means Fairway has a running session row attached to a
task. An in_progress without session label means the task state is active but
Fairway does not have a live provider attachment. That state is acceptable only
for short direct coordinator/orchestrator work with a fresh checkpoint and an
end-of-burst close/reset/block/handoff. For delegated, UAT, production-readiness,
tmux/Claude/Codex external, or multi-step work, register a provider session and
emit a started provider event so the wall can show who is actually attached.
The right rail shows gate readiness and recent activity for quick situational awareness.
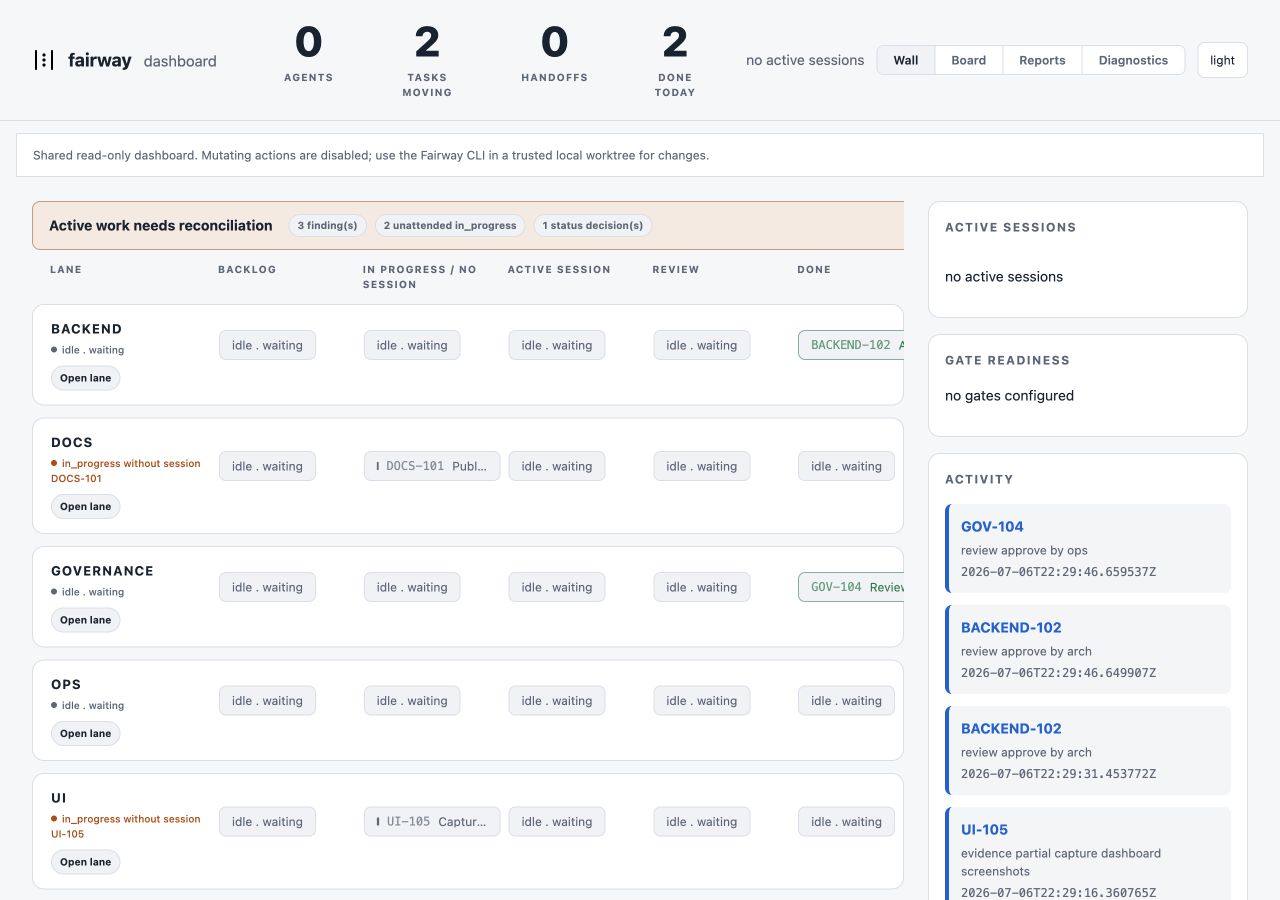
This release-safe wall capture uses a synthetic Fairway fixture. It illustrates the shared read-only coordination posture without exposing customer, production, or consumer operational data.
Accessibility expectations:
- interactive wall and board controls carry labels or visible text,
- board sort state is exposed on table headers with
aria-sort, - focus rings are visible for links, buttons, inputs, selects, textareas, and disclosure summaries,
- dashboard actions remain reachable by keyboard through links, forms, and dialogs rather than pointer-only controls.
When recent work-coverage or CI/deploy learning audits find high-risk advisory issues, the wall shows a compact diagnostics banner with a link to the board diagnostics tab. The banner does not change task state or merge gates; it is a visibility surface for operators to triage uncovered commits, uncovered files, missing evidence/review coverage, or failed CI/deploy evidence without follow-up work.
Board
The board is the working surface for operators.
/board uses a fast-path projection for the default task-table view. It builds
task, health, session, checkpoint, watcher, activity, gate, workstream, saved
view, and visible-table review status data, but defers heavy coordinator plan,
active reconciliation, track-memory, closeout, and audit projections to
/board?tab=diagnostics. The default rail labels that deferred state as
board fast path and points operators to Diagnostics for the full coordinator
and closeout readout. The health strip must not render skipped diagnostic
counters as zero; it labels them deferred or links to Diagnostics until those
projections are actually computed. This keeps routine board refreshes focused on
current task navigation without changing the dashboard trust boundary or hiding
the complete diagnostic surface.
Gate readiness and visible-table missing-review status use batch projections
over existing evidence and review rows. They must not call full task-detail
hydration once per rendered task. Slow-route timing logs should show
dashboard.gates.batch_evidence and
dashboard.missing_review_domains.batch_reviews so regressions back to
per-task TaskDetail loops are visible.
The local dashboard keeps a short in-process snapshot cache for GET read-model data on wall, board, Quality, and reports routes. The cache TTL is intentionally small and request-keyed, and concurrent identical requests are coalesced so one slow projection build serves the waiting callers. Successful dashboard mutations clear the cache before redirecting. The cache never stores POST bodies, never adds dashboard write authority, and does not change the underlying Fairway DB as the source of truth.
The wall route also has a first-response fast path. It retains tasks, health,
sessions, checkpoints, activity, gates, ready state, missing-review status, and
the active-reconciliation banner used by the wall template, but it does not
compute coordinator plan, track-memory, closeout, or audit projections that the
wall does not render. Those read-only diagnostics remain available from the
Diagnostics tab and panel. Slow-route logs identify the skipped work as
dashboard.wall_fast_path; deferred values must not be presented as clean zero
diagnostics.
The root handler is registered only for the exact / route. Unknown paths such
as /favicon.ico and missing assets return a bounded 404 and must not fall
through to Overview or Wall projection construction. Single-project and
multi-project dashboards use the same routing boundary.
Task detail records named timing blocks for core facts, sessions, project task context, activity, usage, active reconciliation, review policy, completion-handback projection, decisions, task-scoped audit, and template rendering. Completion-handback actions are projected from the task's already loaded handbacks, notifications, evidence, and live-window checkpoint. Task detail must not build the project-wide coordinator plan merely to select that task's actions.
Heavy board diagnostics are progressively loaded. /board?tab=diagnostics
renders the normal board shell and independent loading regions, then fetches
/board/panels/diagnostics?panel=coordination|reconciliation|closeout|audit.
Each request computes only its named heavy projection, so a slow coordinator,
audit, or closeout read cannot hold the other panels. The aggregate endpoint
without panel remains the no-JavaScript fallback. Panel endpoints are GET-only,
read-only, use the same request filters, reject unknown panel names, and exist
only to move expensive diagnostic rendering out of the first page response.
Coordinator and audit panel construction use project-scoped batch fact readers;
they must not hydrate every task through TaskDetail. The cold target for each
panel on the current large consumer fixture is three seconds, while the shell remains
available immediately and each panel reports failure independently.
It includes:
- a control-room header with total filtered scope,
- current orchestration recommendation and reason from the same dry-run plan
evaluator used by
fairway coordinator plan, - a read-only coordination intelligence rail with open/stale wait counts, wake targets, last wake attempt, suggested CLI command, track-memory freshness, and next deterministic actions from existing coordinator and memory read models,
- gate readiness above the table, grouped by profile/gate group with blocking, advisory, and report-only misses called out,
- expandable missing-task detail for each gate so exceptions are visible before opening individual tasks,
- workstream progress above the table for quick backlog and completion scans. The board renders an actionable compact subset by default when many workstreams match, preserves filter/sort URL state in show-all/compact links, and orders active, ready, and blocked workstreams ahead of passive backlog,
- search across task ID, title, metadata, tags, status, owner, source paths, target paths, and review domains, with the query mirrored in URL state,
- clearable role/status/project/profile/kind/domain/risk/review-domain/tag filter chips,
- in multi-project mode, the same
/boardtoolbar and table are used; project is a normal filter chip and visible/sortable/exportable table column, - sortable task columns with URL state; shift-click adds a secondary sort key,
- a column chooser with URL-backed visibility and up/down ordering controls,
including an optional
tagscolumn for cross-cutting work buckets, - saved views for named filter, column, and sort combinations. Personal views
are persisted to
~/.fairway/views.json; team views are read from.fairway/views.jsonand are read-only in the dashboard. The first nine personal views are available with Cmd/Ctrl+1..9 shortcuts, - keyboard navigation for board operators:
j/kmoves the row cursor, Enter opens task detail,/focuses search,candvtoggle columns and saved views,xtoggles selection,sandhopen status and handoff dialogs,ttoggles theme,g wgoes to the wall,?opens help, and Esc closes open menus/dialogs, - bulk selection with CSRF-backed Claim, Hand off, Set status, and Record evidence dialogs; terminal status changes remain CLI-gated,
- CSV and JSON export for the current board view. Exports use the active filters, sort order, and visible column set, and include all filtered rows rather than silently truncating at the current page,
- server-side table windows above 200 filtered rows, with sort/filter applied before slicing, total filtered count shown separately, and URL-backed pagination for additional windows,
- operational health badges,
- activity kind and row-count filtering. Activity kind is applied in the store query before the dashboard trims visible rail rows, rather than by fetching a large mixed activity feed first.
The task table is the drill-down layer after the gate and workstream highlights. It links to task detail. The board preserves role/status/project/profile/kind/ domain/risk/review/search/sort/column state when switching between task and diagnostics tabs.
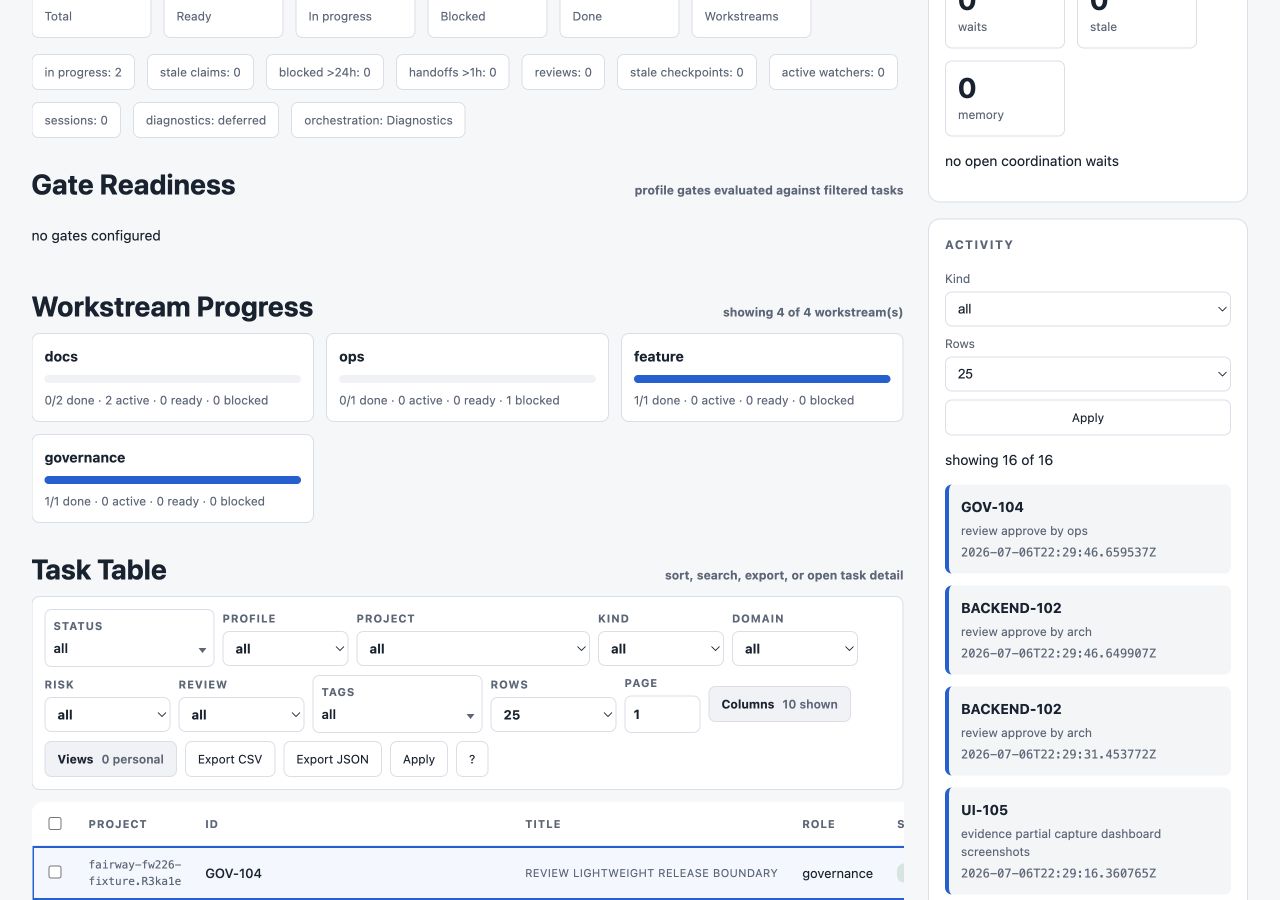
This board capture uses the same synthetic fixture. It shows the operator workstream and task-table surface; it is not evidence of dashboard mutation authority.
The reports view includes the same delivery/process-overhead read model as
fairway delivery report. It shows completed tasks, blocked and review-wait
time, review records, changes requested, approval loops, reopen/retry count,
notification/wake and handoff counts, outcome-source buckets, defect-source
rows, loop signals, and work-batch rollups. Outcome sources describe where
normal evidence came from. Defect sources are narrower and appear only when
review changes/rejects or non-pass evidence (fail, blocked, or partial)
show where an issue was discovered, so passing preflight, deploy, test, or UAT
proof does not inflate defect-discovery counts. These metrics are advisory
evidence for reducing ceremony and investing in tests, preflight, UAT, packet
templates, or automation; the dashboard remains read-only and the report does
not approve reviews, mutate task status, merge, deploy, or release.
The reports view includes a Delivery Resources panel backed by the same
read-only model as fairway delivery resources. It projects typed operational
resources from task and evidence facts: environments, dashboards, docs portals,
binaries, release artifacts, CI pipelines, preflight packets, and rehearsal
targets. Each row shows project, resource type, derived name, owner, state,
source task, blockers, and next safe action. This makes stale dashboard
readback, failed pipeline proof, handoff-ready environment packets, and docs
portal publication evidence visible without adding a second resource store. The
panel is display-only; it does not deploy, restart dashboards, publish docs,
cut releases, approve reviews, merge, or perform live operations. The model is
defined in delivery-resources.md.
The reports view also includes an Owner Rough-Edge Queue projected from
structured rough-edge evidence rows recorded by fairway rough-edge add.
This queue is separate from the generic backlog table so product gaps found
while using Fairway, consumer dashboards, demos, UAT, docs portal flows, or
release/status walkthroughs remain visible with owner, severity, fix-now/defer
decision, expiry, summary, and linked artifact reference. The dashboard only
displays the queue; it does not create tasks, acknowledge edges, send messages,
or mutate backlog state.
The reports view includes a read-only Recipe Library panel backed by
.fairway/recipes/*.json. Each recipe links to the completed source task and
shows recipe metadata plus source-fact counts. The dashboard does not render,
edit, approve, or execute recipes; operators use fairway recipe render in a
trusted CLI/worktree lane when they want a task-specific packet.
Expiry is trustworthy because rough-edge add validates supplied expiry values
up front using the same accepted formats used by the projection: RFC3339Nano,
RFC3339, or YYYY-MM-DD. Invalid expiry text is rejected instead of becoming a
silent non-expiring row.
Task detail shows review waits from the same read model as
fairway review-waits list, including state, blocking flag, target
provider/target, expected response time, suggested action, and reason. It also
shows the effective review-policy rows that merge-ready and task-detail
use, so grouped child tasks show whether a domain is inherited from an approved
parent/group packet, waived, deferred, or still required. Dashboard
missing-review badges use that effective policy instead of raw
review_domains, which keeps grouped-review coverage visible without treating
it as direct approval authority. If a grouped child carries live, release,
irreversible, credential, deploy, security, production, or public-exposure
markers, the dashboard shows inheritance blocked and keeps the boundary review
domains missing until direct review is recorded. This is a read-only visibility
surface; it does not approve reviews, send provider wake prompts, merge,
deploy, or create notification subscriptions.
Task detail also shows completion-handback projection rows and coordinator completion-handback waits. The panel includes next owner/action, completion state, task/live-window context, delivery state, provider target, stale age, and suggested CLI action from the existing completion-handback/coordinator plan read models. This includes live-window closeout or next-decision waits that do not yet have a recorded completion handback. The dashboard remains display-only; it does not send completion-handback wake prompts or write notification rows.
For approval-gated live operations, dashboard control-room state follows
docs/design/live-operation-control-room.md. The dashboard may show live-window
phase, next actor, deadline, authorization posture, stale/missed handoff state,
provider-surface capability readiness, retired/no-go surfaces, replacement
surface requirements, command/prompt, missed-deadline behavior, and suggested
commands derived from existing Fairway read models. It must remain read-only:
provider prompting belongs to coordinator/watch/provider adapters, and live
execution belongs to the accountable operator surface after explicit
authorization. The dashboard must not authorize execution, mutate production,
or send provider messages.
Diagnostics
/board?tab=diagnostics shows operational tables for:
- coordination intelligence waits, wake targets, track memory freshness, and deterministic next actions,
- active reconciliation findings,
- work coverage and CI/deploy learning findings,
- sessions,
- worktrees,
- watchers,
- checkpoints.
The coverage section is backed by the same advisory audit read models as
fairway audit work-coverage and fairway audit ci-learning. It summarizes
uncovered commits, uncovered changed files, orphan evidence count, done tasks
without required evidence, missing review domains, and failed CI/deploy evidence
without follow-up tasks. Findings link to task detail when a task is known and
show the relevant commit, file, evidence artifact, reproduction command, or
suggested follow-up task command when available.
The active reconciliation section includes monitor lifecycle findings such as
monitor_session_without_backing_proof, which means a CI/deploy/UAT/watch
session is recorded as active but has no backing automation id, PID/tmux pane,
external run plus poll command, or fresh bounded manual checkpoint.
The coordination intelligence section is derived from existing Fairway facts: track memory rows, coordinator plan actions, review waits, completion handbacks, and notification metadata. It may show stale memory, open waits, notification mapping gaps, wake target provider/thread, last wake attempt, and fixed CLI recovery suggestions. It does not add dashboard wake authority or write notification, review, task, merge, deploy, or execution state.
Open-wait counts and panels suppress resolved/cancelled review waits,
acknowledged manual waits, superseded completion handbacks or memory, and waits
owned by terminal tasks. The CLI fairway wait list --all remains the explicit
immutable-history surface. Bounded wait resolve --apply recording stays in the
trusted CLI; the dashboard cannot acknowledge or supersede waits.
Track-memory rows also project owner, review date, disposition, and promotion debt. These fields remain read-only: the dashboard cannot refresh, promote, archive, supersede, or otherwise mutate memory.
Environment deploy readiness is also projected from existing task tags,
profile gates, evidence, checkpoints, handoffs, and completion handbacks. A
deploy rehearsal task tagged with values such as environment:staging and
evidence types such as environment-preflight, environment-blocker,
route-readback, worker-access, app-smoke, or rollback-proof appears in
the same task detail, readiness, and report surfaces. The dashboard does not
run deploy preflights, approve promotion, restart services, or mutate the
environment; it only displays the recorded readiness and unresolved blockers.
Diagnostics tables are sortable. The task-table export action is hidden on the diagnostics tab because there is no task table there.
Reports
/reports is the retrospective surface for coordinators and operators. It is
not a raw task table. It answers:
- what work moved during a day or date range,
- what finished versus what only closed monitor/deploy-run bookkeeping,
- which lanes produced product/code/docs/ops outcomes,
- which CI/deploy/UAT runs passed, failed, retried, or still need follow-up,
- which reviews, evidence rows, and handoffs changed merge readiness,
- which tasks were created as findings from CI, deploy, UAT, ops, or security work.
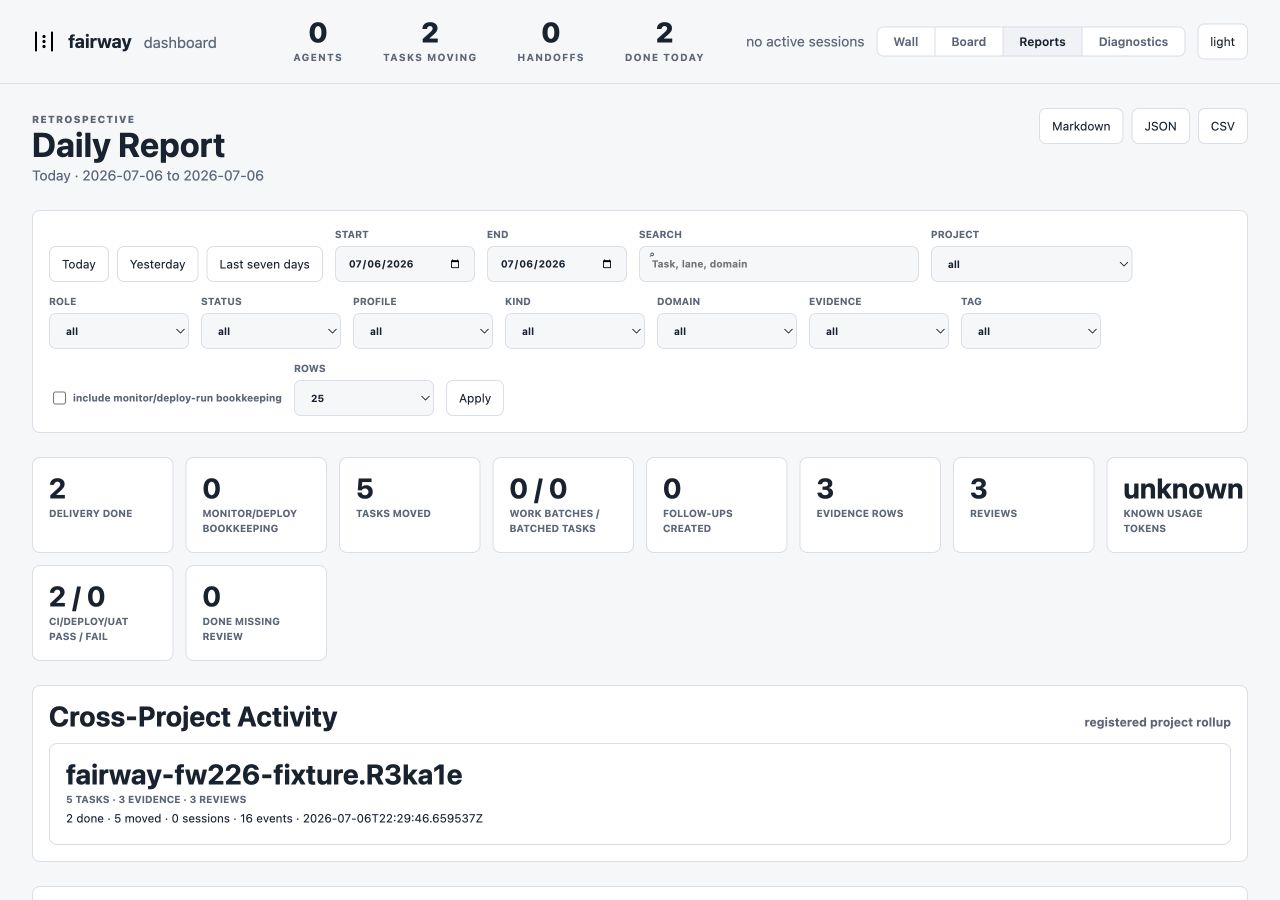
The default report opens to the local current day. A date picker and date-range control allow yesterday, last seven days, and custom ranges. Reports preserve filters in the URL so a coordinator can share or reopen the same view. Report activity and review summaries use the store activity API with the report date window applied at query time.
The page layout should be scannable:
- a compact summary band for completed tasks, moving tasks, active lanes, follow-ups created, CI/deploy results, and review outcomes,
- a lane outcome section grouped by role/domain/kind with short task links,
- a CI/deploy timeline that separates monitor closures from implementation work,
- a finding section grouped by
CI-FIX,CD-FIX,UAT-BUG,OPS-FIX,HARNESS-FIX, andDOC-FIX, - a review/evidence section showing newly satisfied gates and missing required review domains,
- a rule-pack signal section showing selected task-rule matches, tasks with missing rule evidence, blocking gaps, advisory gaps, and non-applicable rules,
- a delivery resources section showing environment, dashboard, docs portal, binary, release, CI, preflight, and rehearsal resource readiness,
- a recipe library section showing reusable prompt/runbook packets extracted from completed source tasks,
- a bounded task table for drill-down, with pagination and export.
Visual density should match the board: restrained cards, clear section rhythm, small status chips, progress bars only when they summarize a real denominator, and no nested cards. The default view should show the highest-signal sections above the fold before any large table.
Reports support Markdown, JSON, and CSV export for the selected date range. Markdown export is intended for daily summaries and handoffs. JSON and CSV are intended for audit, analysis, and external planning tools.
Task Detail
Task detail uses the same dashboard shell with a compact detail header. The
first panel uses the same deterministic common-path recommendation as
fairway work status: current action, suggested command, blocker, and boundary
status. Primitive counts and the authority explanation remain available through
the Audit detail disclosure and the rest of task detail. Required reviews are
labelled as closeout requirements, not proof that an early reversible task is
already blocked. Ambiguous session or reconciliation state fails closed. The
recommendation is read-only and cannot create evidence, reviews, approvals, or
merge, deploy, release, or live-operation authority.
The remaining detail includes:
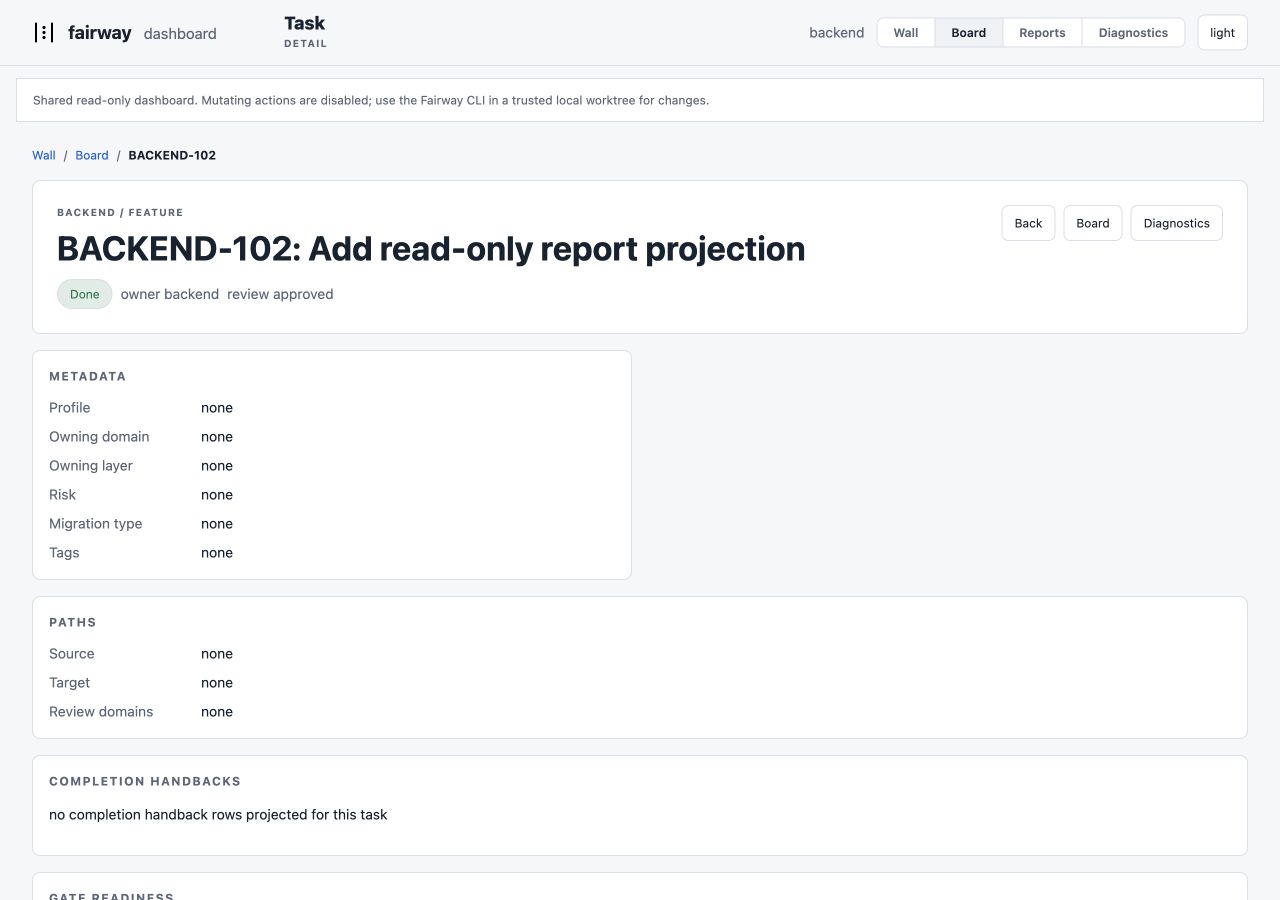
- flow breadcrumbs back to Wall and Board,
- direct actions back to Board and Board Diagnostics,
- task status, owner, review status, and descendant rollup,
- CSRF-protected claim and non-terminal status update controls,
- metadata and source/target paths,
- task-scoped profile gate readiness, including matching evidence counts and
missing evidence reasons from the same evaluator used by
merge-readyand board gate rollups, - applicable rule-pack checks, including rule mode, match status, required and missing evidence types, review domains, stop conditions, and non-applicable rationale,
- notes, dependencies, and acceptance checks,
- transition history,
- evidence, with raw artifact path readback and a redacted
viewlink only when the artifact path is recorded evidence for that task and resolves inside[fairway].local_artifact_paths. The safe viewer renders Markdown, JSON, text, and HTML as escaped/redacted HTML, labels evidence aslocal-only,internal-only, orpublishable, rejects path traversal, rejects symlink escapes outside allowed roots, and never serves remote URLs or arbitrary filesystem paths. Redaction is applied to the full artifact before display truncation. Supported redaction classes include bearer tokens, authorization/cookie/set-cookie headers, token/secret/password/API key fields, common OAuth/client credential fields such asaccess_token,refresh_token,id_token,client_secret, andssh_private_key, and internal URLs for localhost, RFC1918, Tailscale/CGNAT100.64.0.0/10,.local, and.internalhosts. The viewer is a defense-in-depth convenience for local operators, not a publishing sanitizer, - a UX media evidence panel for
screenshot,video,browser-trace, anduatartifact types so operators can see whether user-visible work was exercised. The panel displays artifact references and a redaction-required boundary only; it must not display raw secrets, auth tokens, provider-private transcripts, prompt bodies, or unredacted user data, - task-scoped work coverage and CI/deploy learning diagnostics,
- task-bound sessions,
- handoffs and reviews,
- missing required review domains before merge-ready.
Task detail is intentionally task-scoped. Global sessions, worktrees, watchers,
and checkpoints remain in /board?tab=diagnostics so the detail page does not
become the old mixed dashboard.
The Back action returns to the referring board view when the referrer is
local. If the task is opened directly, it falls back to the board filtered by
the task role.
Mutation Scope
The CLI remains the complete write surface. The dashboard exposes only small, audited coordination mutations:
- claim a task,
- move a task among non-terminal states.
Every dashboard write uses a CSRF token and records an audit event. Terminal status changes still go through the CLI so evidence, handoff, review, and profile gates cannot be bypassed from the browser.
Stack
- Go
net/httpfor the server. html/templatefor server-rendered HTML.- Server-Sent Events for live activity updates.
- Embedded templates under
internal/dashboard/assets/templates. - Embedded CSS and JS under
internal/dashboard/assets. - No build step, no node modules, no external browser resources.
fairway dashboard starts the server in the foreground at
127.0.0.1:7878 by default and opens the system browser unless --no-open or
[dashboard] auto_open = false is set.
For long-running local coordination, use:
fairway dashboard start
fairway dashboard status
fairway dashboard restart
fairway dashboard stop
start runs the dashboard detached, records the child process in
.fairway/dashboard.pid, and appends logs to .fairway/dashboard.log.
Detached lifecycle commands do not open a browser unless --open is passed.
restart is the preferred recovery command after a host app, terminal, or
agent runtime restart.
status, start, and restart print the Fairway binary version and binary
path used by the lifecycle command. Use that readback before and after replacing
a long-running dashboard so operators can tell whether the served dashboard is
still an old binary:
fairway --json dashboard status
fairway dashboard restart --listen 127.0.0.1:7878 --read-only --no-open
fairway dashboard status
fairway version
When running more than one dashboard from the same config, such as a shared
read-only instance on 127.0.0.1:7878 and a local full-access instance on
127.0.0.1:7879, give each instance its own pid and log files:
fairway dashboard start --listen 127.0.0.1:7878 --read-only \
  --pid-file .fairway/fairway-dashboard-7878.pid \
  --log-file .fairway/fairway-dashboard-7878.log
fairway dashboard start --listen 127.0.0.1:7879 \
  --pid-file .fairway/fairway-dashboard-7879.pid \
  --log-file .fairway/fairway-dashboard-7879.log
dashboard status reports unknown instead of stopped when the requested
listen address is already occupied but the selected pid file is missing, empty,
or stale. That state means a dashboard-like process is listening, but the
current lifecycle command cannot prove which process or binary owns it. Pass the
matching --pid-file for managed multi-instance dashboards, or stop/restart the
listener from the operator lane and record fresh status evidence.
Dashboard routes emit dashboard_timing log lines when a request takes longer
than the built-in slow-route threshold. The line includes the route, path, total
duration, and named projection blocks such as dashboard.tasks,
dashboard.gates, dashboard.gates.task_detail_loop,
dashboard.missing_review_domains, dashboard.coordinator_plan,
dashboard.closeout_reports, reports.facts, and template rendering. Loop
blocks include counts, for example task_detail_calls=50, so operators can see
whether a slow route is dominated by broad read models, N+1 task detail loops,
or template rendering before changing dashboard behavior.
The /events stream uses a durable event-source cursor rather than hydrating
the full event history on every poll. A new connection starts at the latest
cursor unless the browser supplies a valid Fairway Last-Event-ID; reconnects
then request only newer facts. State, evidence, handoff, review, notification,
and provider-session facts trigger task-scoped review-wait projection, while
time-based stale review waits use a bounded sweep over active review tasks.
Idle polls perform only the latest-cursor check and periodic SSE keepalive; they
must not rebuild project-wide review waits or gate state every second. This
keeps one idle client below the dashboard CPU budget without weakening the
existing event-latency target or adding dashboard mutation authority.
The version from dashboard status should match the release binary intended for
the dashboard restart. For shared read-only dashboards, also probe the local
origin and the identity-aware proxy boundary after restart. If the local
execution surface cannot signal an old listener, use the approved tmux/SSH
operator lane to stop the old PID and restart from the reviewed binary; do not
fall back to an untracked foreground process.
In a signed disconnected installation, the foreground and managed dashboard
may run without Git on PATH. Git-backed worktree and lane-closeout diagnostics
then render as deferred with an explicit diagnostic instead of failing startup
or displaying false clean/merged state. Coordinator diagnostics also suppress
ready-task claim and batch-dispatch recommendations until Git visibility is
restored. This does not emulate Git state: repository workflow commands
continue to require the Git executable and fail closed when it is absent.
Harness Analysis On Task Detail
Task detail renders the same deterministic fairway.harness-analysis.v1
projection as fairway harness report. The read-only panel shows recorded
attempts, actions, evaluator results, evaluator-backed outcomes, usage
denominator coverage, and cited trajectory findings. It also shows why cost or
a ratio is unavailable instead of turning missing telemetry into zero.
The panel has no redirect, approve, accept-evidence, task-state, policy, or promotion control. A repeated pattern is a prompt for engineering judgment, not a command to the attached harness. Its cited record identities and explicit false-positive limit let a reviewer inspect the source facts before asking the owner to reframe a hypothesis, change execution strategy, or emit a progress observation.
Multi-Project Mode
fairway dashboard --multi aggregates registered projects via SQLite
ATTACH DATABASE. See multi-project.md for the registry
and command surface.
The multi-project board is a read-oriented operator surface. It uses the same
template, filter query state, saved-view links, pagination, and export routes as
single-project mode. Each row carries a dashboard-only project label from the
registry entry, exposed through the project query parameter and Project
table/export column. Task identity, ownership, evidence, reviews, and gates
remain authoritative inside the source project store.
The multi-project reports surface extends the same read-only boundary to
retrospective activity. /reports shows a Cross-Project Activity rollup by
registered project with task, evidence, review, session, and activity counts,
and the drill-down table carries a Project column so duplicate task ids from
different DBs do not collapse together. Project, profile, role, tag, status,
date-range, and evidence-type filters apply to the report and its JSON,
Markdown, and CSV exports.
The registry can include multiple entries with the same repo path when they
point at different Fairway DB/config identities. This is useful for a consumer
repo that tracks implementation and documentation work in separate Fairway
configs. In that case /projects shows each entry's path, config, and DB so
operators can tell same-path workstreams apart before filtering the board or
wall.
The multi-project wall is also read-oriented. / renders collapsible project
sections, each with the standard role lanes. /projects remains available as a
compact registry summary. /wall redirects to /.
Security Posture
- Binds to
127.0.0.1by default. - If
[dashboard] listenis changed to a non-loopback address, Fairway prints a startup warning. - Mutations use CSRF tokens and write audit events.
- No external resources are loaded.